
The Enrolled Course Statistics dashboard provides organizations with a real-time overview of continuing education course registrations made by connected team members.
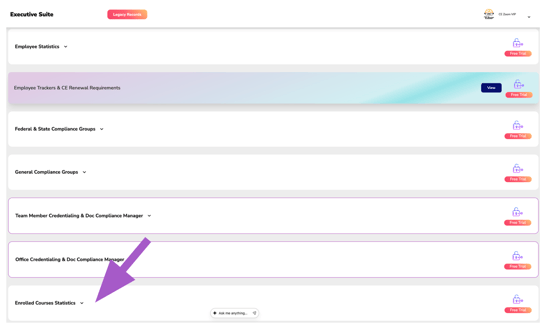
Statistics are organized by Educational Method, allowing organizations to quickly compare registrations for Live and Self-Study courses.
Understanding Enrollment Statistics
The statistics displayed on this dashboard are based on the registration date—the date an employee enrolled in a course—not the date the course takes place.
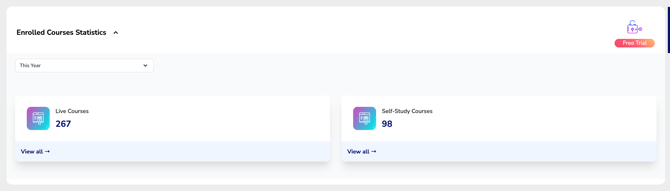
This allows organizations to measure employee enrollment activity during a selected time period, regardless of when the course is scheduled.
Statistics are separated into two educational methods:
- Live Courses – Registrations for live continuing education events.
- Self-Study Courses – Registrations for self-paced continuing education courses.
Date Filter
Use the Date Filter to select the time period you want to analyze.
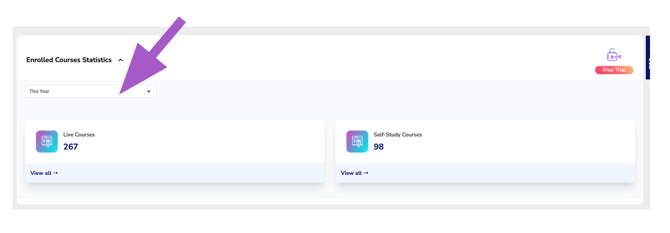
Changing the date range automatically updates the enrollment statistics displayed on the dashboard based on registrations made during the selected period.
This makes it easy to monitor enrollment trends over time.
View Enrollment Details
Each Educational Method includes a View All button.
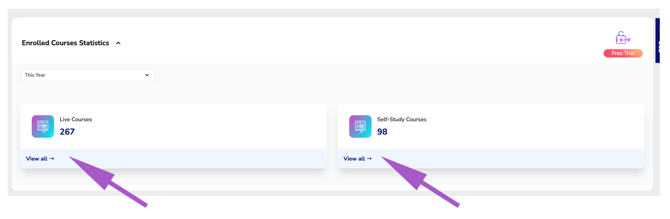
Selecting View All opens a detailed breakdown of the employees included in that statistic, along with additional enrollment analytics.
The detailed view includes:
- Total Courses Enrolled In
- Based on Registration Date
- Based on Course Date
- Total Registered Attendees
- Based on Registration Date
- Based on Course Date
- Total Attendees Completed
- Number of attendees who completed their courses
- Completion percentage
- Total Certificates Issued
- Number of CE certificates issued
- Percentage of attendees who earned certificates
These additional statistics provide deeper insight into employee participation, course completion, and continuing education activity across your organization.
Registration Date vs. Course Date
Some statistics display values using two different reporting methods:
Registration Date
Counts activity based on when an employee enrolled in the course.
Example:
An employee registers for a course in January that takes place in March.
- Registration Date: January
- Course Date: March
Course Date
Counts activity based on when the course actually occurs, regardless of when the employee registered.
This allows organizations to analyze enrollment activity separately from actual course participation.
Summary
The Enrolled Course Statistics dashboard provides organizations with valuable insight into employee enrollment activity across live and self-study continuing education courses. By tracking registrations, comparing registration dates to course dates, and monitoring attendance, completions, and certificates issued, organizations gain a clear picture of employee engagement and continuing education participation throughout the organization.